
Blockchain as a Platform for an Ecosystem
By Chris Plance, Executive MBA lecturer
The value of a modern firm is driven overwhelmingly by three factors – the utilization of information asymmetry, the value of the firm’s platform, and speculation over the firm’s growth prospects. The performance of assets, intellectual property, et al can be reduced to these three components of value:
| V = V(information asymmetry)+V(platform)+V(growth speculation) |
The concept of information asymmetry is deeply ingrained in firms. This concept means the business knows less, or more, about something at a point in time. An example of this may be that our firm SYA has sole access to information that one of its markets has a heavily watched cooking show that will be doing a week of recipes with bananas. This gives SYA information it can use to sell more bananas (generate revenue) and outperform the competition – which are unaware of banana week. Information asymmetry is fundamental to business. Information asymmetry is found under IP and Trademark protections, market research capabilities,and data held on customers. These are highly valued, both quantitatively and qualitatively, and are often at the core of senior management and board room discussions. A significant factor of information asymmetry is that it is significantly negatively impacted by time. The graph below shows a proposed value (V) of some information over time (t).
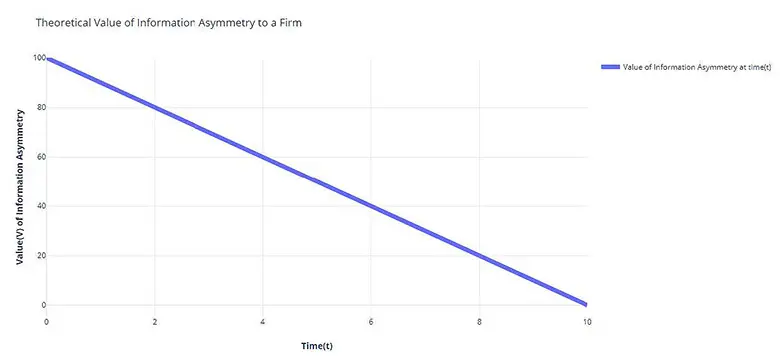
This proposed value reduces all types of information asymmetry into one trend line. For example, the value of intellectual property will look like a step function, whereas information with no legal protections may look like (1/t).
Nearly all discussion around information asymmetry takes place at t=0. This is when the asymmetry is most valuable and compelling as an asset. It should be noted though that the value can decrease quickly. This is due to a number of factors, most notably competitors determining this information on their own, or reverse engineering. Regardless of the reason, the value decreases leaving a business to search for more information at t=0. It is important to note that time (t) is likely being compressed by both technology (making it easier to record, compile, and analyze information), highly competitive global markets, and irregularities between nations in the protection of this type of asset. It is likely that these pressures are increasing the steepness of the slope, while also increasing the value (y) at t=0.
Understanding that the value of information asymmetry is decreasing over time is the point where one can begin to make an argument for the impact of the Network Effect on the value of a firm. In the Network Effect, time is not a factor in determining value. Instead, the number of participants, or more importantly, the percentage of total participants on the platform are what determines the value. This value does not face the downward pressure of time and technology that quickly erodes the value of information asymmetry.
Unlike information asymmetry, the Network Effect is well modeled, though not often used by firms as it is very difficult to achieve. Mostly the Network Effect is seen as an ultimate prize for a handful of firms who can achieve this with the creation of a platform that gains monopoly, or near monopoly, status. Examples of firms achieving the Network Effect are Bell Telephone, Facebook, and Google's search platform. The idea of a Network Effect was first proposed by Robert Metcalfe in 1975 as a result of research into telephone networks. Subsequent research has resulted in Reed’s Law for social networks. This paper relies on modeling via Metcalfe’s Law as past studies are available proving the validity of the model with real data (Facebook and Tencent valuation11). These studies show that the value of the platform V ∝ n2 but at a cost C ∝ n.
For example, take three publicly traded firms – Equifont, Experia, and Transion. These firms trade information used for decision support in matters of issuing credit. Each firm controls approximately 30 percent of the market with the last 10 percent being held by assorted niche firms. For this example, nmax will be 10 nodes. Each node representing a potential customer of one of the three firms. Each firm has stock (E) trading at $1 per share. We will also assume that the value of growth speculation has neared zero as these three competitors are mature and the market is in some sort of equilibrium. No firm has established platform dominance, and the ecosystem of the firms are in partial equilibrium. In this partial equilibrium, the value of Vs(the value of growth speculation) on equity value of each firm is near zero and can be disregarded. The value of the network effect on each firm’s equity value can be modeled via Metcalfe’s Law as shown below:
(1 1 - Zhang, Xing-Zhou; Liu, Jing-Jie; Xu, Zhi-Wei (2015). "Tencent and Facebook Data Validate Metcalfe's Law". Journal of Computer Science and Technology. 30 (2): 246–251. doi:10.1007/s11390-015-1518-1. https://link.springer.com/article/10.1007%2Fs11390-015-1518-1 )
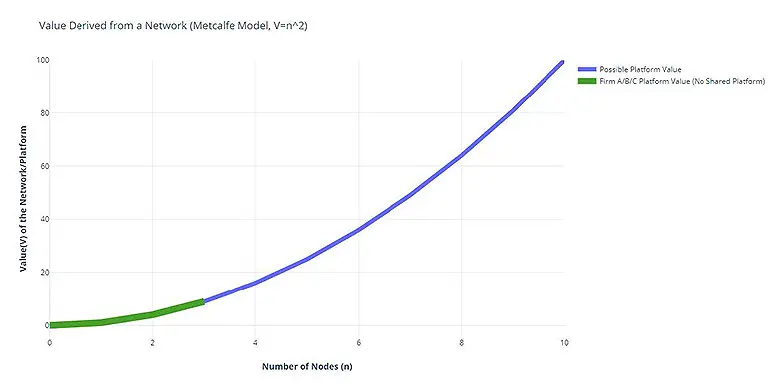
As all three firms operate with independent platforms, the value of each firm’s platform is nine (or also 9 percent of the total possible value considering nmax is 10). Therefore, the equity value of each firm also reflects the value of the platform. While each firm controls 30 percent of the market, they each only obtain 9 percent of the total possible value of an entity with a platform servicing the entire market. If the equity value of the firm is $1, then:
| E = V(information asymmetry)+V(platform)+V(growth speculation) $1 = V(is)+9+0(no growth speculation) $1 = V(is) +9 |
These firms are all investing their resources into maximizing V (information asymmetry), though we know that the full value of the V (network effect) in our scenario is 100 and each firm is only capturing 9 percent of that value. It is in each firm’s financial best interest to collaborate in some fashion – but this historically has not occurred. Why? The design of traditional technology solutions answers this question. Traditional designs are centralized and introduce new risks to the firms that they are unable to accept. These risks include firms needing to cede some level of control to a competitor, or possibly worse a middle man who then gains some market power over all three firms. These risks are further discussed later in platform flexibility. An example of an attempt to do this are using clearinghouses for healthcare claims processing. At best this has left healthcare firms at risk of losing control of the process, at worst it has opened the door for these clearinghouses to disrupt their business.
The answer to this requires decentralized technology solutions. These solutions were not practical from a technology, or an expense perspective, until the 2000’s with the creation of blockchains. Thus, a platform can now be built wherein firms share the platform – without ceding control to a competitor or a middle man. Firms themselves determine the governance structure and rules in place in these solutions. This then allows competitors in an ecosystem to share a platform – and thus begin to maximize the value of the firm’s equity via the platform. In our case, the three firms would then all be operating on the same platform which has the following network value.
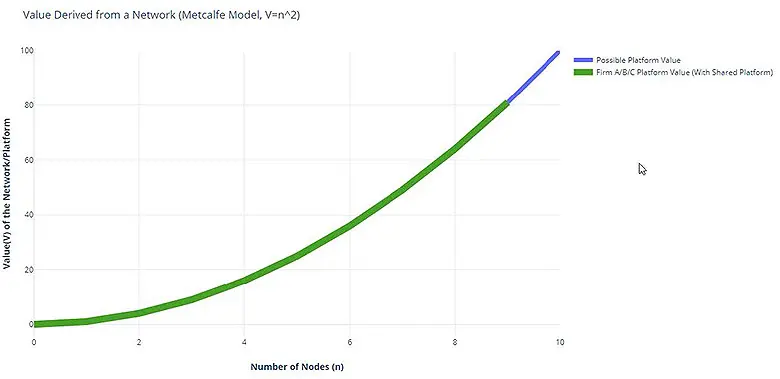
This platform now has a V (platform) of 81 (or 81 percent of the total possible value considering nmax is 10). Now each firm still only controls 30 percent of the market, but the platform being used by each is now worth 900 percent more than operating independent platforms. This difference (with nmax =10) of Vindependent=9 and Vshared=81 is a 900 percent increase in value. This increase in value is a result of many customers now being on the same platform, and thus some, or all, of this 900 percent increase should be reflected in the value of the equity of the firm.
Thus, if we look at the value of these firms equity (E), we would expect to see:
| Eindependent = $1 ----> Esharedmax = $9 |
It is uncertain if the entire value of the shared network effect would be priced into the equity of each firm, some portion of the value will be. One possibility is that the difference in network effect values Vdiff (Vshared-Vindependent) would be split among the number of firms sharing the platform. For our scenario this would look like.
| Eequifontindependent = $1 ----> Eequifontshared = Eequifontindependent +(Vdiff/3) Eequifontindependent = $1 ----> Eequifontshared =$1 +(720%/3) Eequifontindependent = $1 ----> Eequifontshared = $2.40 |
Regardless of what method is used for distributing the value of the Network Effect over these firms, the equity of each firm experiences a significant increase. An increase that produces value for a time (t) that is exponentially longer than found in information asymmetry.
Interestingly, the firms who may benefit most from the Network Effect are non-profits which have no equity. In these cases, the platform expands the reach of all non-profits participating. This is a direct impact on the ability of a non-profit to service their mission, and will directly impact the organizations ability to fund raise.
Also note that this ability for firms in an ecosystem to share a platform has additional long-term advantages. Firstly, it creates some barrier to entry for new entrants either by an inability to show value, or the existing firms denying access to the shared platform. Furthermore, it is not unreasonable to imagine a scenario where firms are evaluating a new entrant’s impact on the value of the platform via network effect as a litmus test for adding or denying them use of the platform.
Press: For all media inquiries see our Media Kit


